Sam360 can automatically meter software usage of all applications running across the network. This includes
- Windows® applications
- Web applications (Internal and external)
- Legacy client/server applications accessed through Terminal Emulator applications
- Virtualised applications presented through Citrix, Microsoft RDS (Terminal Services, RemoteApp etc.) & Microsoft App-V
 E.g. Microsoft Office Daily Usage Details
 E.g. Microsoft Office Application Usage Details
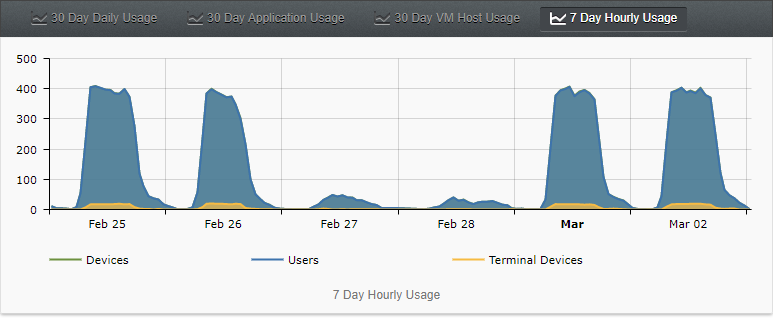 E.g. Microsoft Office Hourly Usage Details
Sam360 offers both an agent based and an agent free method for metering software.
Agent Based Software Metering

The easiest way to enable software usage data collection is to deploy the Sam360 software metering agent to each device to be metered. This includes user desktops & notebooks, but also RDS servers (Citrix, Microsoft RemoteApp etc.) and VDI VM images. The agent loads in to each user’s Windows® session and tracks…
- Which applications (and products) are executed
- Which application has user focus
- Execution context information (e.g. Active domain for web browsers, active server for terminal emulators)
- When applications start and finish
- To which terminal applications are streamed (RDS Servers, VDI VMs)
Agent Free Software Metering
In some situations, it may not be practical or feasible to deploy an agent to collect software usage data. Sam360 offers a ‘lighter weight’ alternative that collects high level application usage data without the need for an agent. The Sam360 Management Point can be configured to take periodic remote snapshots of software usage data from RDS servers. A snapshot includes the following information for the moment the snapshot is created…
- Which applications (and products) are executing
- To which terminals applications are streamed for all current users

Snapshots do not record which application has user focus or exactly how long an application was used for. However, if they are created periodically (e.g. every 15 minutes) for an extended period (e.g. 1 month) they can collect over 99% of all applications that are executed by a particular user, on a particular server from a particular terminal/thin client. Often this information is sufficient in determining software licensing requirements.
Clients can choose either method or adopt a hybrid approach using a combination of both agent based and agent free metering. The following table outlines some of the major difference between both options.
| Agent Based | Agent Free | |
|---|---|---|
| Deployment | ||
| Environment Supported | All Windows® devices from Windows XP SP3 & Windows Server 2003 onwards | All Windows® servers from Windows Server 2008 onwards. Terminal Services/Remote Desktop Services must be enabled. |
| Software | Sam360 Agent must be installed on each device to be metered | A single Sam360 Management Point can remotely meter up to 2,000 RDS servers |
| Proxy | If all internet traffic is routed through a proxy, each user must be allowed to access Sam360 servers without manual authentication | Only the Management Point user requires access through the proxy to Sam360 servers |
| Local Firewall | No change required | Management Point needs access to WMI and SMB service on RDS servers. (UDP & TCP Ports 135, 139 & 445) |
| Data Collected | ||
| Applications Used | 100% | ~99% |
| Thin client name | Yes | Yes |
| Focussed Application | Yes | No |
| Context Information e.g. Active Browser Domain | Yes | No |
| Resource Footprint | ||
| Process | 1 instance of s3agent.exe per active Windows® session. | 1 instance of s3mp.exe per Management Point. |
| Process Memory | s3Agent.exe has private working set of <4MB | s3mp.exe has private working set of ~ 15MB Can go to 50MB while snapshotting up to 1000 servers. |
| Process CPU | s3agent.exe very rarely registers over 0% in Task Manager. | s3mp.exe idles at <1% CPU. CPU usage increases slightly during snapshot activity |
| Network Bandwidth | ~40B/s per user | ~5B/s per user |
| Transmitting Sockets | Peak: 10 per 1,000 active Windows® Sessions | Peak: 5 per 1,000 RDS servers |
| Open Sockets | Peak: 300 per 1,000 active Windows® Sessions | Peak: 10 per 1,000 RDS servers |
Notes
1 Software metering is not required to determine the most recent user of a device. A normal Sam360 inventory scan detects & records all current device users. Daily inventory scanning can create a basic view of users of a device.
Sample Software Metering Reports
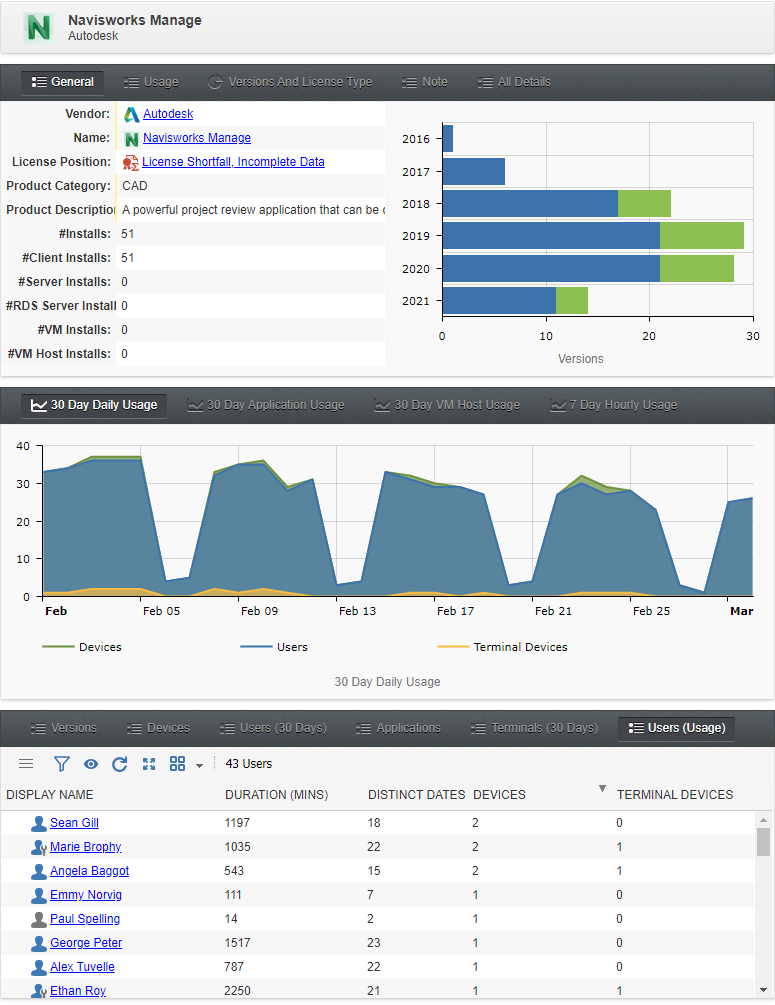 Sample Usage Report For Autodesk Navisworks
The default software usage report includes the following user metrics for the last 30 days
- Who has used the product
- How many computers has each user used the product on
- How many clients has the user streamed the product to (i.e. Using Citrix/RemoteApp/Parallels etc)
- How many distinct days the user has used the product
- How long the user has used the product i.e. How long was it the focus window
It’s possible to change the period for these reports and limit them to a subset of computers.
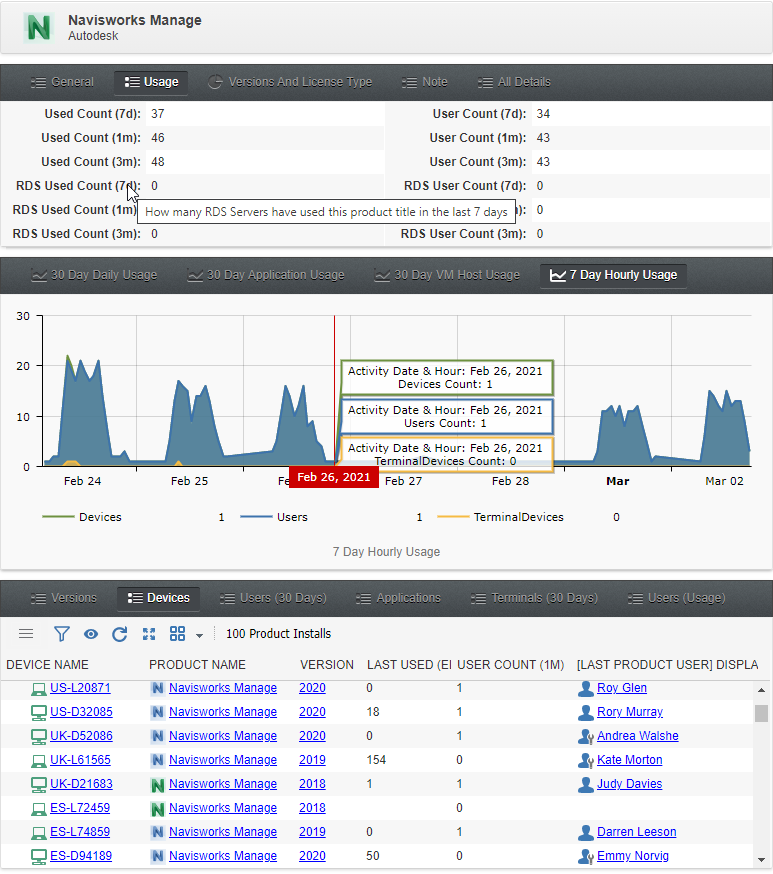 2nd Sample Usage Report For Autodesk Navisworks
The default software usage report also includes
- User counts for the last 7 days, 1 month & 3 months
- Active computer counts for the last 7 days, 1 month & 3 months
- Other computer usage details including
- Count of product users on computer
- Last date of product usage
- Name of most recent user of product
- Name of most recent user of device
- How many clients has the user streamed the product to (i.e. Using Citrix/RemoteApp/Parallels etc)
- How many distinct days has the user used the product
- How long has the user used the product i.e. How long was it the focus window
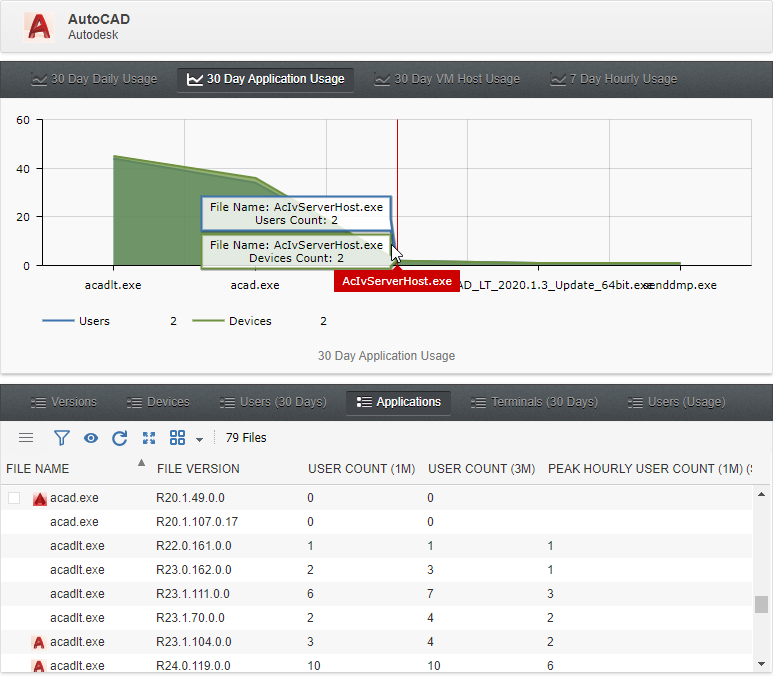 Application Usage Report For Autodesk AutoCAD
Per Application (i.e. executable) reporting is also included in the standard usage reports.
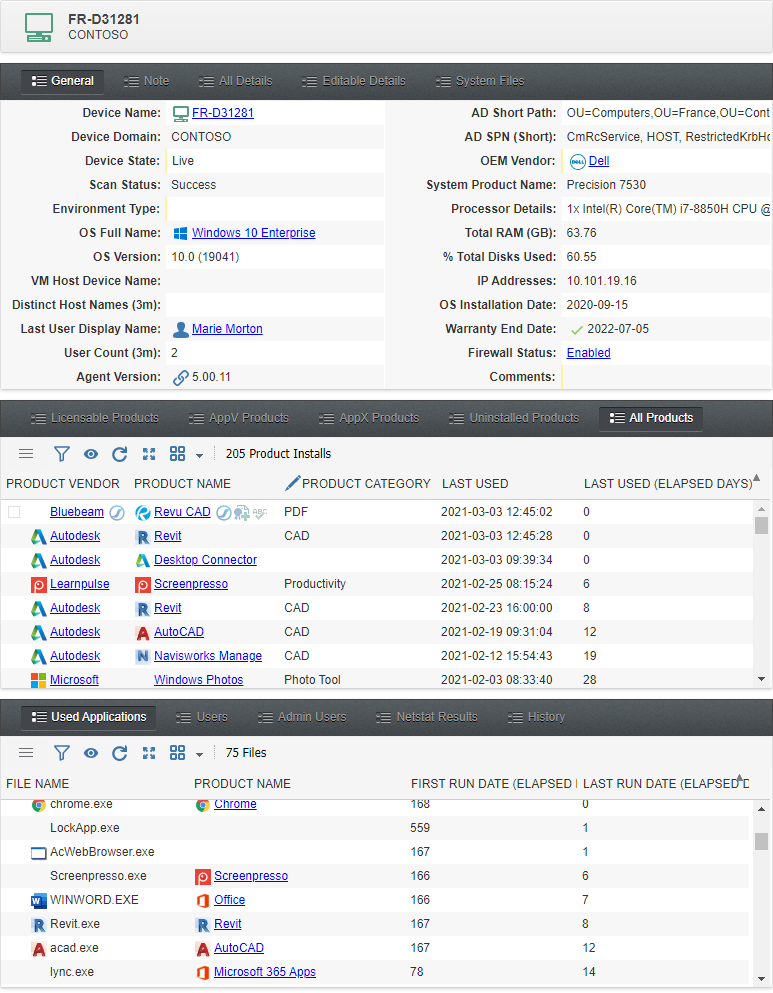 Sample Software Usage Report For Computer
The default computer report includes the following usage metrics
- Name of last user of computer
- List of all previous users of computer
- The last date each installed product was used and the name of the user
- The first and most recent dates each application was used
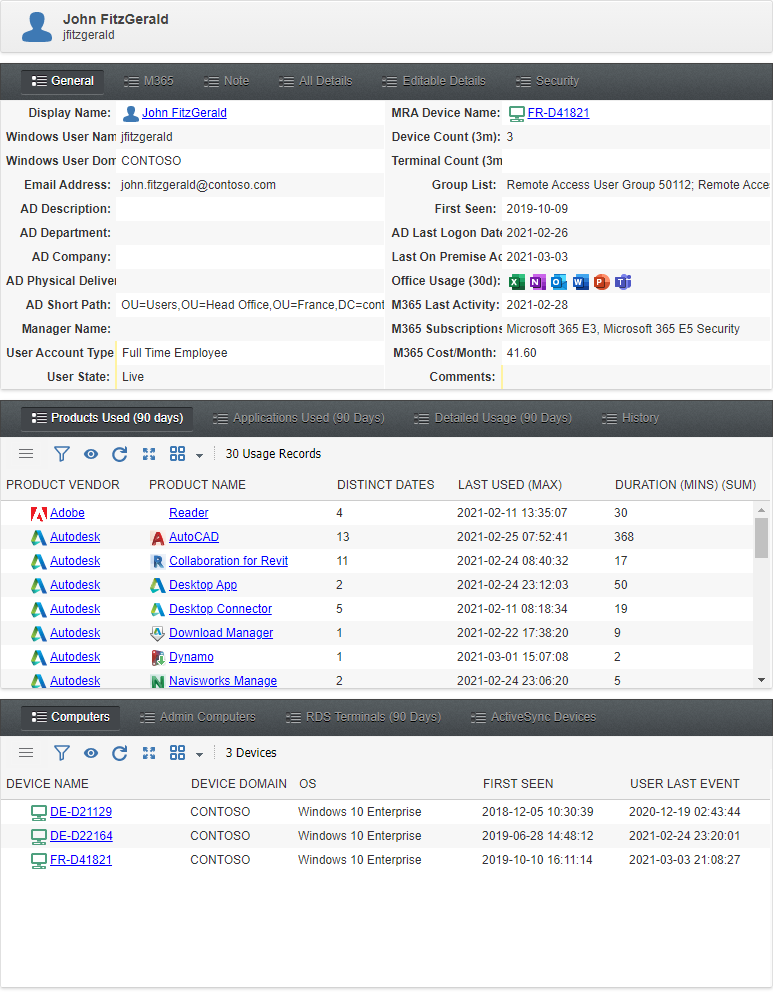 Sample User Report
The default user report includes the following usage metrics
- Name of all computers the user has used
- List of all products the user has used including
- Date of last usage
- Count of distinct days the user has used the product
- How long the user has used the product over 90 days i.e. How long was it the focus window
- How long the user has used the product per day
- Individual application (executable) usage metrics


Leave A Comment